by Penny Angeles-Tan | Oct 7, 2024 | Business
Iran’s attack on Israel dampened the #Uptober tradition in the crypto ecosystem. Most crypto prices have dropped, including Solana and XRP. How are the two crypto tokens doing now?
Uptober, a joyful tradition in the crypto ecosystem every October, seems to be faltering due to conflicts between countries. The reason is, that since Iran attacked Israel the crypto market has turned red, and so have Solana price and XRP.
Let’s take a closer look at SOL and XRP. The discussion will also include Solana pricing and XRP price now so you can find out what the condition of both of them is in real-time.
Why is October Special in the Crypto Ecosystem?
The Uptober tradition in crypto is not a traditional tradition which reflects the increase in crypto token prices. Apart from the volatile nature of crypto, various other factors can also make October a sad month for crypto token holders.
However, here are some reasons why October has been special in recent years for the crypto ecosystem.
1. Market Strengthening After Summer
June to September were indeed slow months for the crypto ecosystem. Starting from the price of Bitcoin, Solana, XRP, Ethereum, and various other crypto tokens experiencing price declines.
After the summer, conditions improved. One reason is that institutional investors return to the office after their holidays and interest in trading and investment has strengthened again.
2. October Becomes Encouragement
The end of October becomes a bridge to Q4 where investors begin to tighten their belts to welcome strong final results. Market activity also increased with crypto holders starting to strategize fully so that purchasing power becomes greater.
3. Movement of Various New Projects
Often various projects are presented in the final quarter of each year, ranging from large industries to new regulations welcoming the new year. This is why crypto prices often strengthen in October because there is new hope for the future.
Uptober Contaminated by Iran and Israel Conflict
Iran’s attack on Israel in early October shook the investment world, including the crypto ecosystem. When news of the conflict between the two countries heated up, the majority of crypto prices immediately went red, including Solana and XRP.
Uptober is widely doubted by crypto players. Coinglass data shows that more than $351 million was withdrawn from the market in the last 24 hours at the time of the reported Iran attack.
Current Solana and XRP Price Chart
Let’s analyze the current prices of XRP and Solana. These two tokens are known to be strengthening, especially XRP which is currently raising its ETF project. However, it can be seen that the price of XRP to USDT is still red.
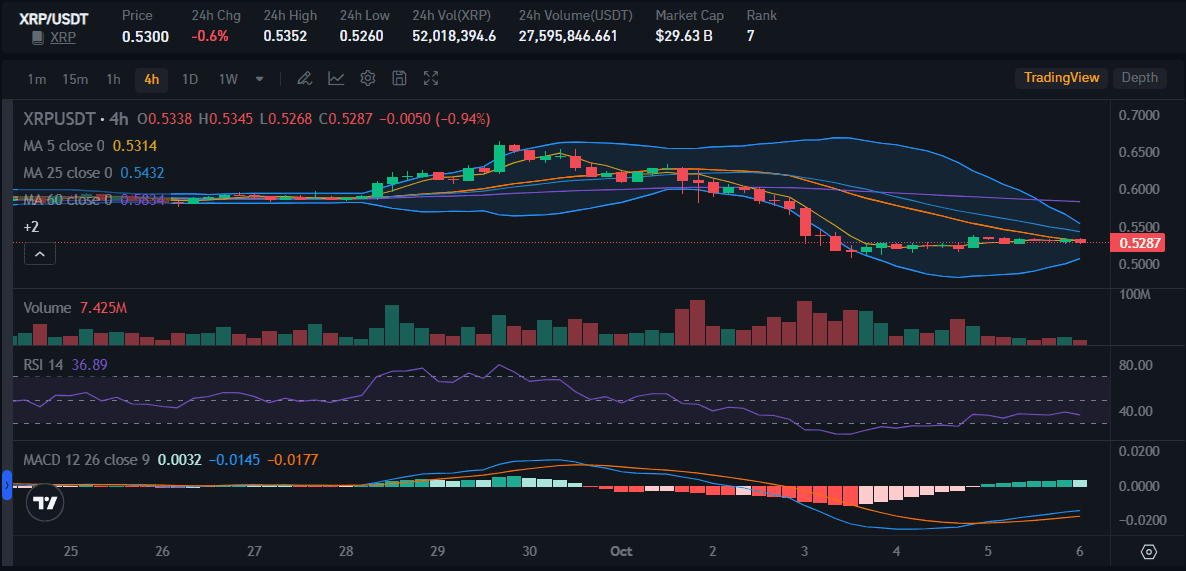
XRP still seems to respond negatively to existing conflicts. The current price of the token is $0.5300 with a decline of -0.6%. The RSI indicator is in free fall at 36, which means that if it falls again then there is overselling and XRP bearishness will certainly occur.
However, XRP’s MACD line is struggling to rise through the boundary line. If XRP can prove its strength, the line can rise and the bearish trend will be broken, replaced by a bullish trend.
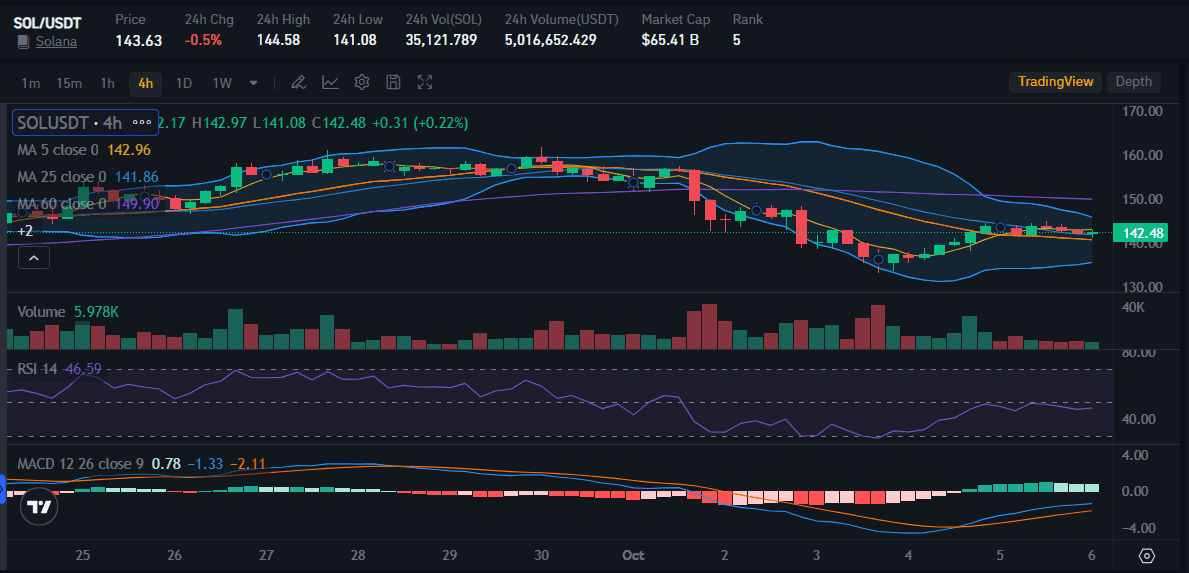
SOL to USDT was also the same as XRP, decreasing by a similar percentage, namely -0.5%. Currently, Solana is trading at $143.63, having previously reached its highest price of $144.58 in the last 24 hours.
However, Solana still shows a stable situation. The RSI indicator is still at 46, which means that even though the selling trend is more dominant than the buying trend, there is no excessive selling.
The MACD indicator is below the limit line, but looks like it is trying to return above. Solana still has a possible bullish trend.
Conclusion
That is information about Solana and XRP regarding the Iran and Israel conflict. You have to be more careful in deciding to invest in the crypto ecosystem at times like now. Research must be further deepened.
Bitrue will help you to do detailed research. Real-time price checking is available to you for free and you can even convert prices from USD to XRP, SOL, BTC, ETH, and prices of every other crypto token. That way, you can understand better how to buy SOL, XRP, and other crypto tokens.
by Penny Angeles-Tan | Oct 5, 2024 | Business
On October 1, Iran launched an attack on Israel with 180 missiles. The attack caused the majority of crypto token prices to fall. So, what about the price of Bitcoin? Here’s the explanation.
Recently, the world has heated up again due to Iran’s attack on Israel. This conflict causes various investment instruments to experience price changes. Specifically, gold increased along with rising oil prices due to the conflict in the Middle East. So, what impact will Iran’s attack on Israel have on Bitcoin price?
You can see the development of Bitcoin prices after Iran attacks Israel and what the condition of the token price is now in this article. Read the detailed explanation until the end of the article.
Impact of Iran’s Attack on Israel on Bitcoin Prices
October has just begun and the world already seems chaotic. This was due to 180 Iranian ballistic and hypersonic missile attacks on Israel on Tuesday, October 1. Just after this attack, the crypto ecosystem immediately reacted. Almost all crypto tokens are colored “red” in response to tensions between the two countries.
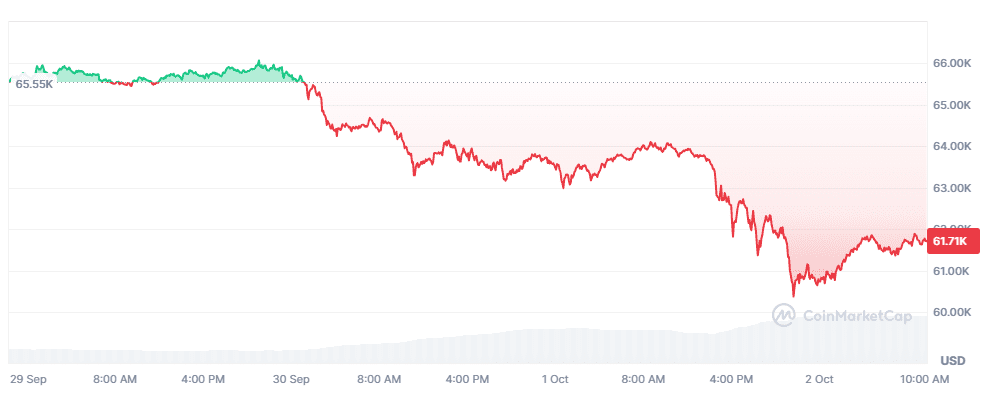
This price decline was also experienced by BTC. Bitcoin prices fell quite drastically with a percentage decline in the range of 2-3%. In fact, on September 30 Bitcoin touched $65,000 after experiencing a long decline.
It is reported that BTC will also experience an increase in October after feeling it in September. However, due to the Iran-Israel conflict, these hopes were dashed.
Bitcoin and Its Response to World Conflict
Bitcoin does have an unfavorable trend in its response to world conflicts. Bitcoin tends to experience a decline when conflicts between countries arise.
As during the conflict between Russia and Ukraine in 2022, Bitcoin even experienced a decline of up to 7.9% and the price plunged below $35,000. Bitcoin even had a negative impact during the geopolitical conflict between the United States and China in 2018 and 2020.
However, Bitcoin once gave a positive response, namely when North Korea conducted a nuclear test in 2017. At that time, the price of Bitcoin soared with a continuous upward trend.
Current Bitcoin Price Chart
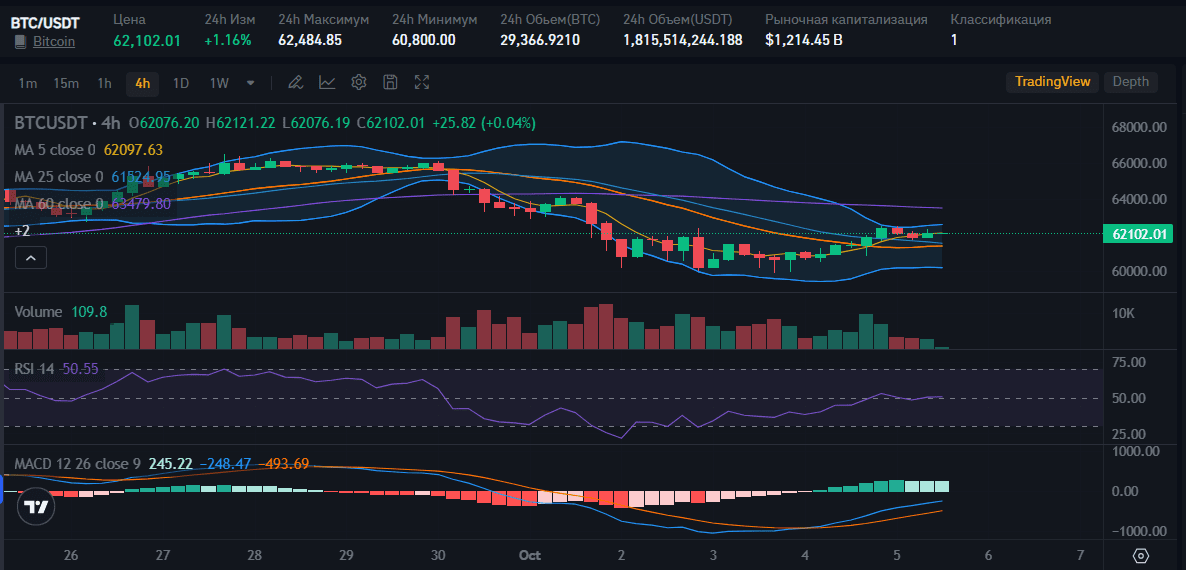
At the moment, harga BTC to USDT indeed experienced an increase of 1.16%. Although the price is still below $63,000, the increase is quite encouraging. The BTC token RSI indicator shows a number above 50, which means that currently, the buying trend is slightly dominating over the selling trend.
The positive Bitcoin RSI number is also reflected in the MACD line. It can be seen that the BTC MACD indicator is trying to rise above its limit line. This means that if the line continues to hold and is sustainable in its increase, a BTC bullish trend will occur and the price of Bitcoin will experience a sustainable increase.
Conclusion
The explanation of the impact of Iran’s attack on Israel on Bitcoin prices has reached its end. Even though it is enough to make the majority of investors worry and temporarily switch to traditional investment instruments, Bitcoin’s price is showing its strength again.
It is best to watch out for the high volatility of crypto tokens both positively and negatively. This is why we must conduct in-depth research when investing in the crypto ecosystem.
If you are currently doing independent research on Bitcoin to find out what its current condition is, Bitrue can help you. Bitrue has various features that you can use for independent research, starting from checking prices in real-time, finding out price conversions from BTC to USD, to articles that you can check to find out about current developments in crypto trends.
That way, you will understand about how to buy Bitcoin overall. Also, adjust your financial capabilities in determining how you invest in BTC and other crypto tokens.
by Penny Angeles-Tan | Oct 2, 2024 | Business
Ethereum (ETH) price today has decreased. However, the prediction of Ethereum price increase to $ 10,000 is still strong with the existing technical data. Here is the full explanation.
Amid today’s declining crypto market conditions, ETH is predicted to achieve a price increase of $10,000. However, today Ethereum price also fell like the majority of other crypto tokens.
So, how can ETH get a predicted price increase? Even though ETH’s recent performance has also underperformed compared to BTC.
Current Ethereum (ETH) Price Chart
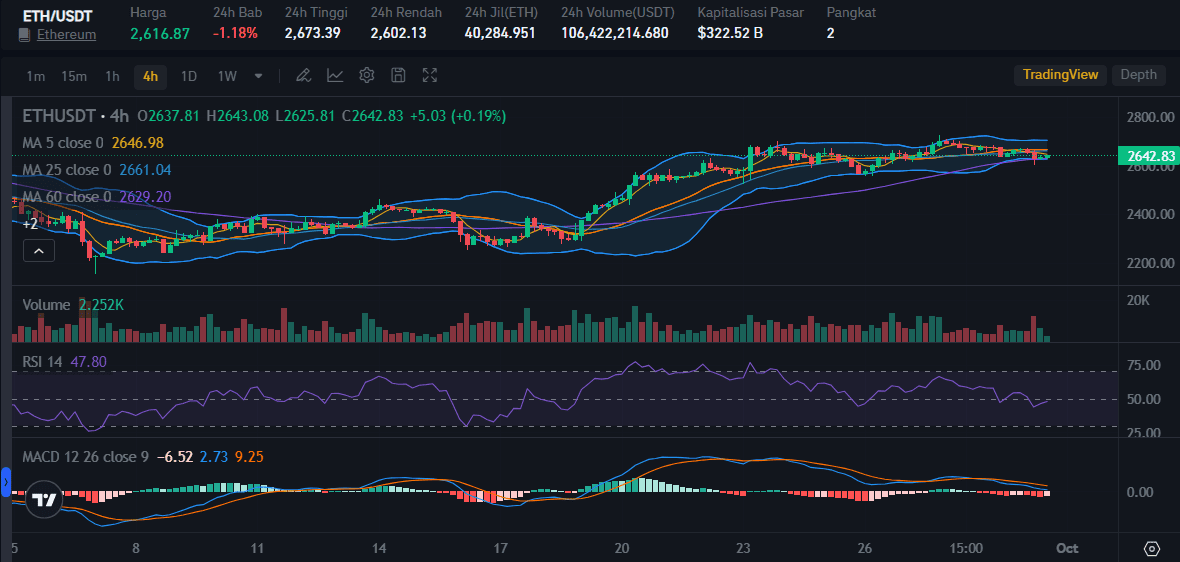
Above is the ETH to USDT price chart taken from the Bitrue website. When this article was written on September 30, Ethereum was trading at $2,616 with a decline of 1.18% in the last 24 hours. Previously, during the same period, ETH was at $2,673 as its highest price.
The number on the ETH RSI indicator is 47.80, which means that ETH is safe, not in an over-selling condition even though there is a decrease in purchasing numbers.
Ethereum’s MACD condition is also quite safe with the graph declining but not yet touching the boundary line. Thus, ETH bearishness is technically not coming any time soon.
Are There Signals of an Ethereum Price Bullish?
Recently, Ethereum has experienced poor performance. Several times the price of ETH was in the red even though the majority of crypto tokens were rising.
However, it is predicted that global macroeconomic trends will provide benefits for Ethereum. M2 money supply growth will support Ethereum price increases.
Later, when the central bank eases monetary restrictions it will create a new surge in liquidity in Ethereum which is also in line with Bitcoin.
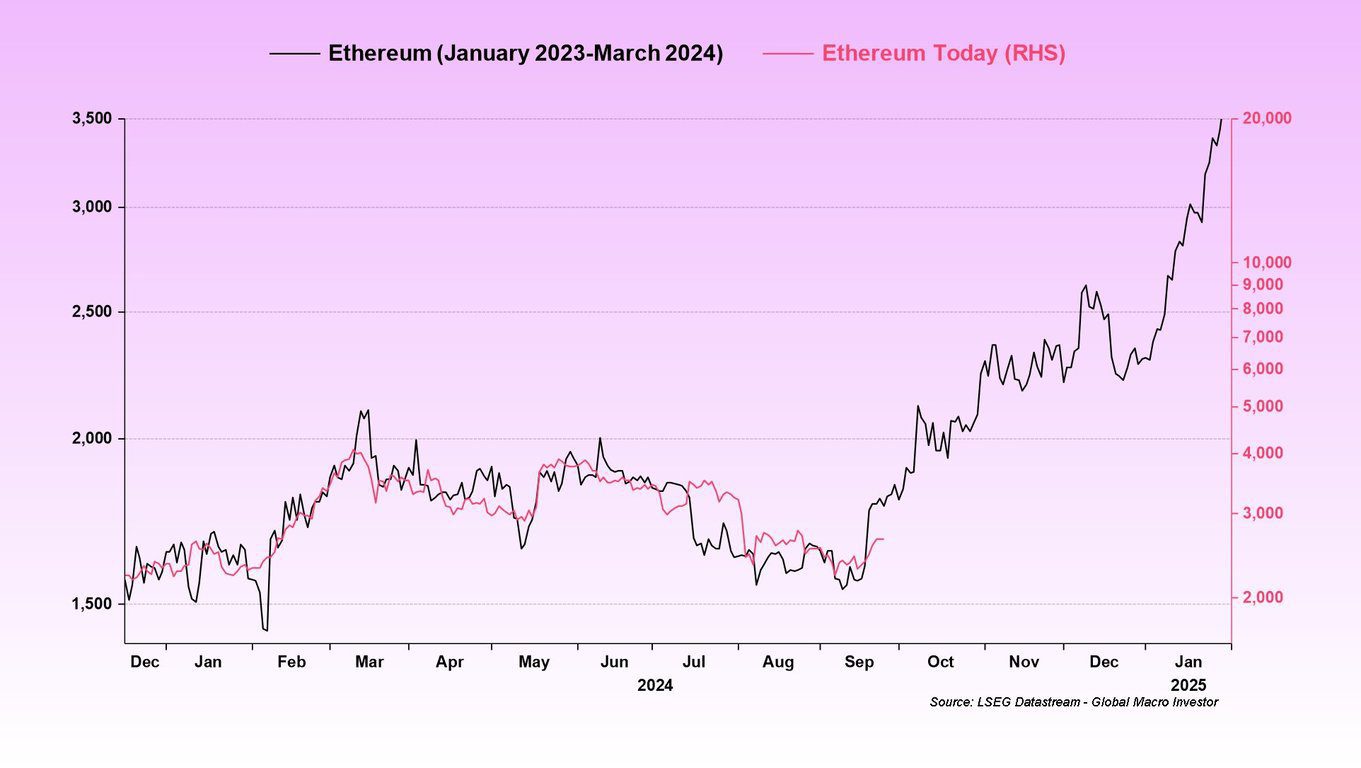
Beyond global macroeconomic trends, Julien Bittel, head of macro research of Global Macro Investor, stated that ETH could reach its $10,000 price target shortly by conducting a technical analysis of Ethereum.
This is because there are similarities between the current Ethereum price chart and 2023-2024 when ETH experienced a sharp increase.
However, today’s Ethereum price drop is nothing to worry about. This is because the crypto market condition is not currently good. The majority of crypto tokens experienced price declines of varying amounts.

Not only the prices of large tokens, such as BTC, ETH, SOL, USDT, and BNB but also various meme-coins also experienced price declines. GameFi tokens that have been hotly discussed recently, such as HMSTR, NOT, and DOGS, are also following this downward price trend.
Conclusion
This is information about the downward trend in the price of Ethereum (ETH), complete with a discussion of how to predict the price increase in the future.
For those of you who want to learn how to buy ETH, Bitrue has a solution for you. Many features can be used, starting from checking ETH prices in real-time, reading the latest information about Ethereum, to checking conversion prices from ETH to USD easily.
By conducting in-depth research before buying crypto tokens, you will be more secure so you can easily determine an investment budget according to your financial condition.
by Penny Angeles-Tan | Oct 1, 2024 | Business
Today, Bitcoin price is down. Is it true that Bitcoin no longer dominates the crypto ecosystem? Understand how BTC is doing to other crypto tokens by reading this article until the end.
Bitcoin Price today it’s down. Even though the decline is not too big, this decline is a sign that the crypto ecosystem is not in good condition. The reason is, not only Bitcoin, but the majority of crypto tokens are also experiencing prices plummeting today.
What is the real state of the crypto market now? Is it true that there will be a major price correction in the future and the price drop in the majority of crypto tokens today is the start of that price correction? Check out the explanation below.
Current Bitcoin Price Chart
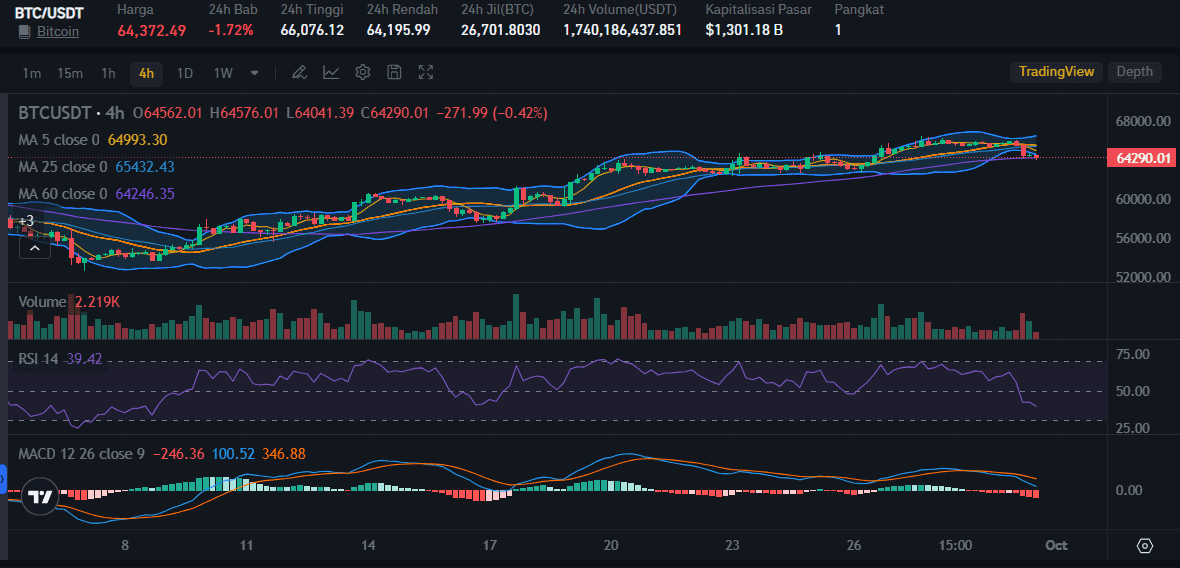
As of today, the price of Bitcoin to USDT has decreased by 1.72%. Perhaps, this decline does seem small because the current BTC price is still above $64K. However, previously Bitcoin was for $66,076, which means the price of BTC has fallen quite a lot at this time.
Looking at the Bitcoin price graph taken from the Bitrue market above, the RSI value is quite worrying because it is at 39. This means that if the BTC RSI value falls again, then BTC will be recorded as experiencing over selling and this will make the BTC price fall further.
The BTC MACD indicator also decreased with a fairly wide distance between the two lines. This condition makes predictions of bearish BTC stronger.
Bitcoin Predicted to Rise in Q4
There is a unique curse that is widely believed among analysts and crypto observers, namely Bitcoin which always gets worse in September. This is not even just a curse that can be taken lightly because there is underlying data.
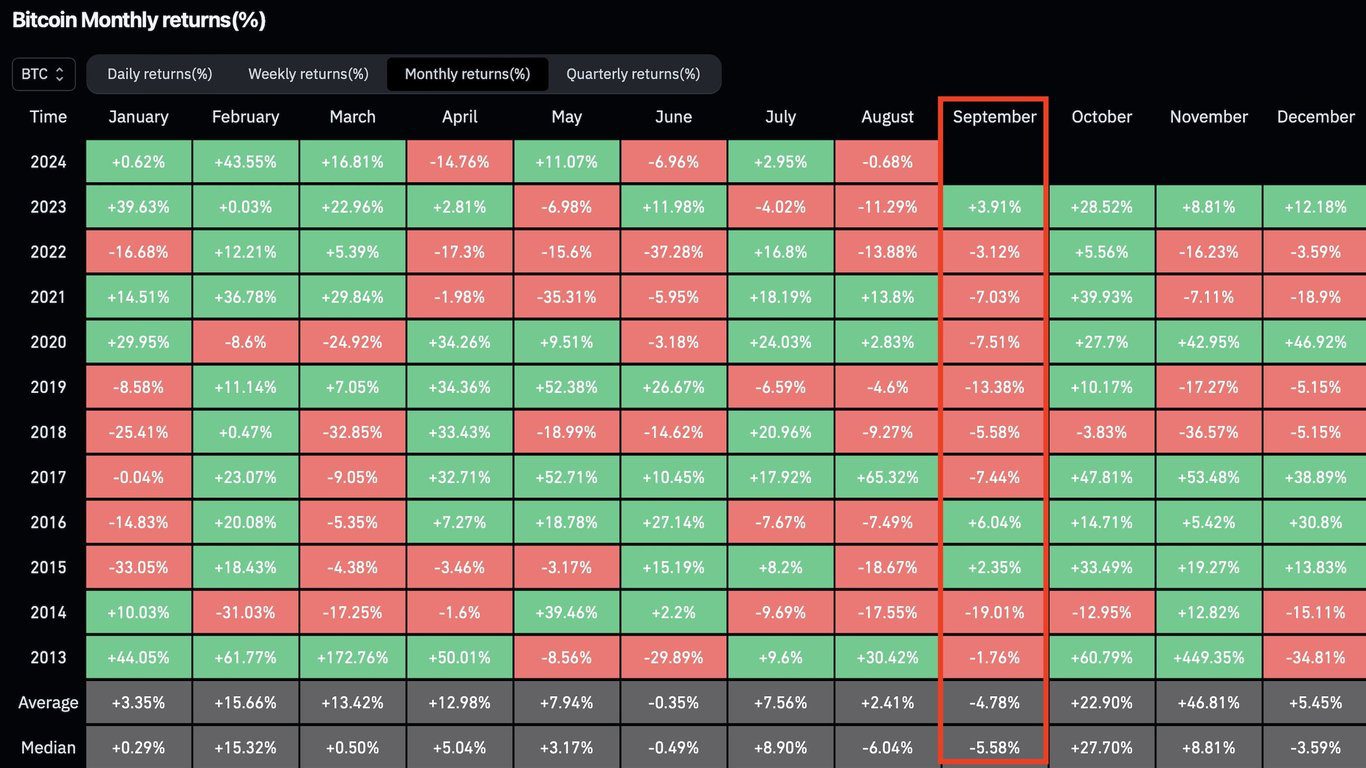
Above is data on the decline and rise in Bitcoin prices since 2013. You can see that every September, BTC experiences a price decline. If this data continues, it means that BTC token holders will be happy because it means that in October BTC will experience another price increase.
Crypto Ecosystem Will Experience Price Correction?
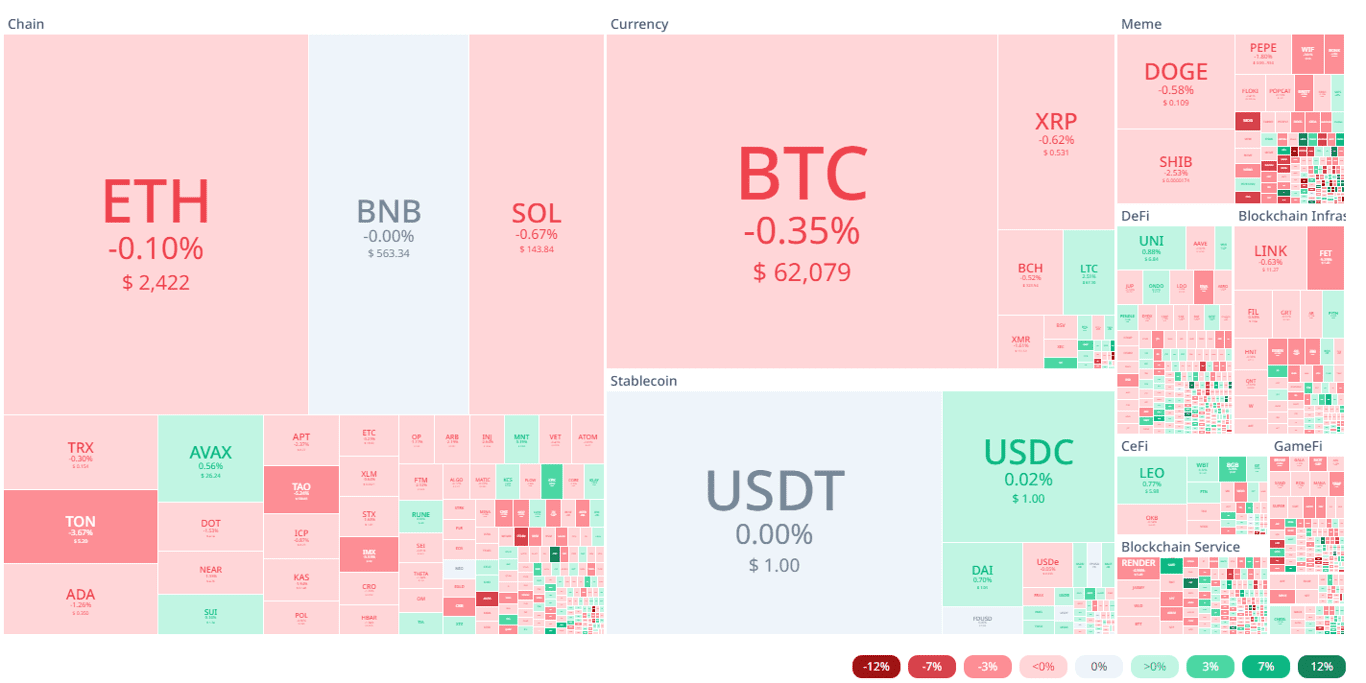
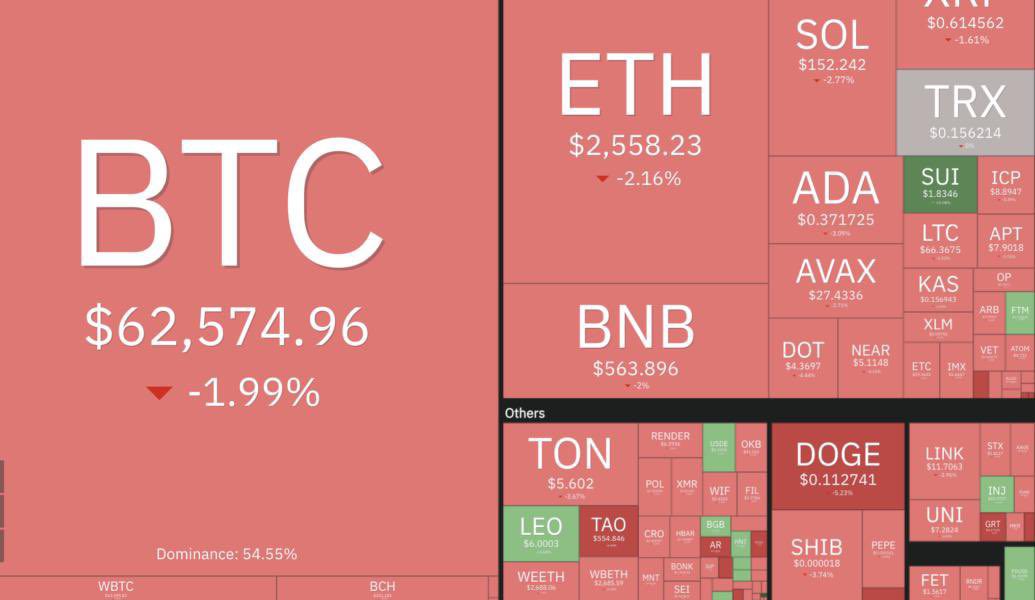
Currently, the majority of crypto tokens are red. Not only Bitcoin, but Ethereum, Solana, BNB, USDT, and various memecoins also experienced price declines.
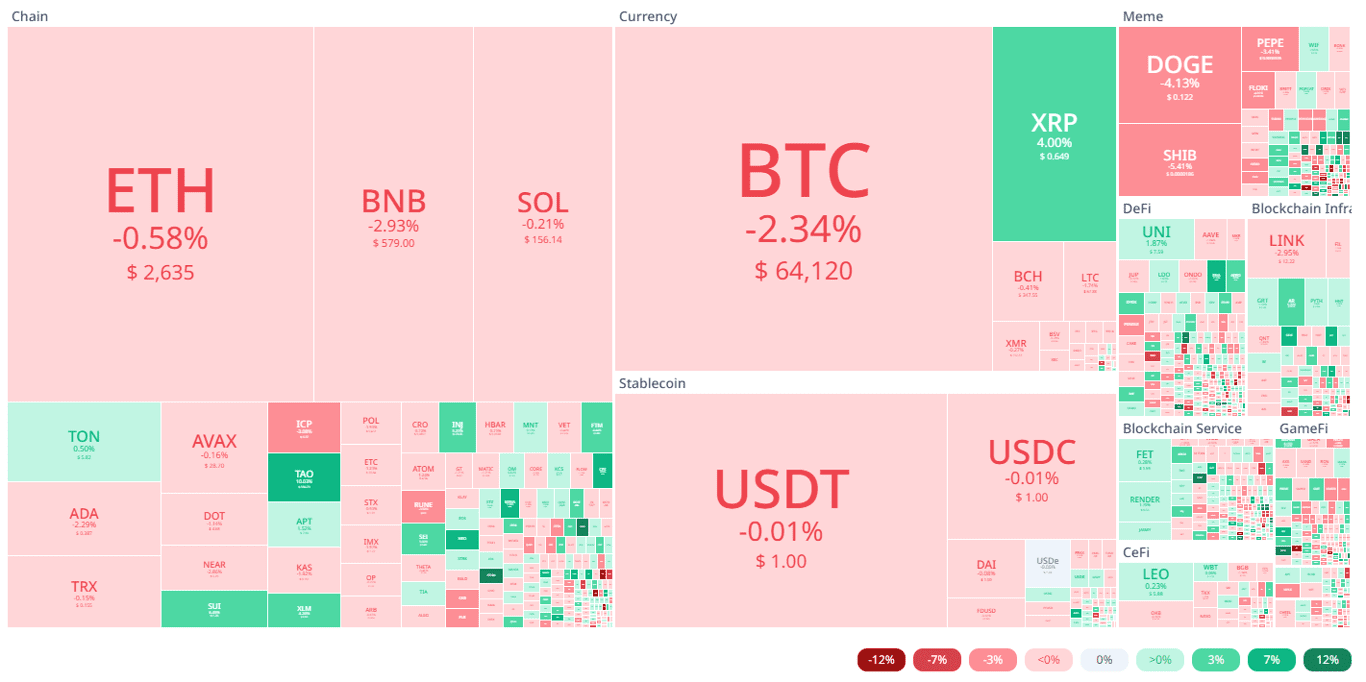
You can see from the screen capture the crypto ecosystem heatmaps taken from Cryptorank above. Many crypto tokens are experiencing price declines. The price decline is not that high, but this needs to be looked at more carefully because it is not just one or two tokens that have dropped in price.
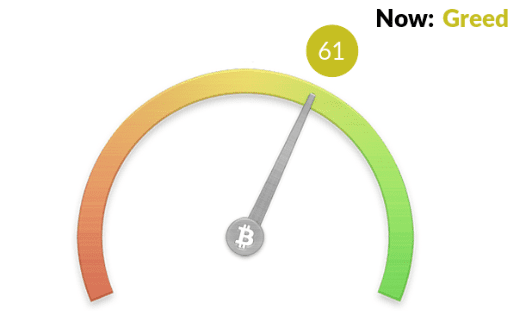
This correction prediction is supported by Fear & Greed data. Currently, the crypto ecosystem is in the greed phase, which means that there is a chance for correction in the future. This greed phase has been going on since yesterday even though in the previous week, the crypto ecosystem was in the Neutral phase.
Quoted from Trading View, Bitcoin’s role is currently quite dominant with a dominance figure of 57.17%. This Bitcoin dominance figure decreased by 0.63% in 24 hours.
Conclusion
That’s an analysis of the price of Bitcoin and how the crypto market conditions are as of today, September 30. If you are currently researching Bitcoin or other crypto tokens, you can directly visit the Bitrue website.
There are many interesting features on Bitrue that you can use to do research before investing in crypto. You can check the token price and convert it to the current USD price, for example, BTC to USD to find out the latest information on the crypto ecosystem by reading articles on the Bitrue blog.
If you are a new player in the crypto ecosystem, Bitrue is also a website that makes it easier for you to learn how to buy BTC and other crypto tokens.
by Penny Angeles-Tan | Sep 23, 2024 | Business
Bitcoin price rose quite sharply after the Fed announced a rate cut. At the same time, whales sold BTC in large amounts. How does this affect the BTC price?
Bitcoin price soaring up The Fed officially announced an interest rate cut. After struggling to reach $60,000 for a long time, BTC has now jumped to more than $63K.
Understand the current BTC price chart analysis. And is it true that there is a whale who sells BTC in large quantities? Check out the reasons and implications for the crypto industry.
Current Bitcoin Price Chart
When this article was written on September 20, 2024, the price of BTC to USDT is soaring at $63,749 with an increase of +2.93% in the last 24 hours. In the same period, BTC reached its highest point at $64,133.
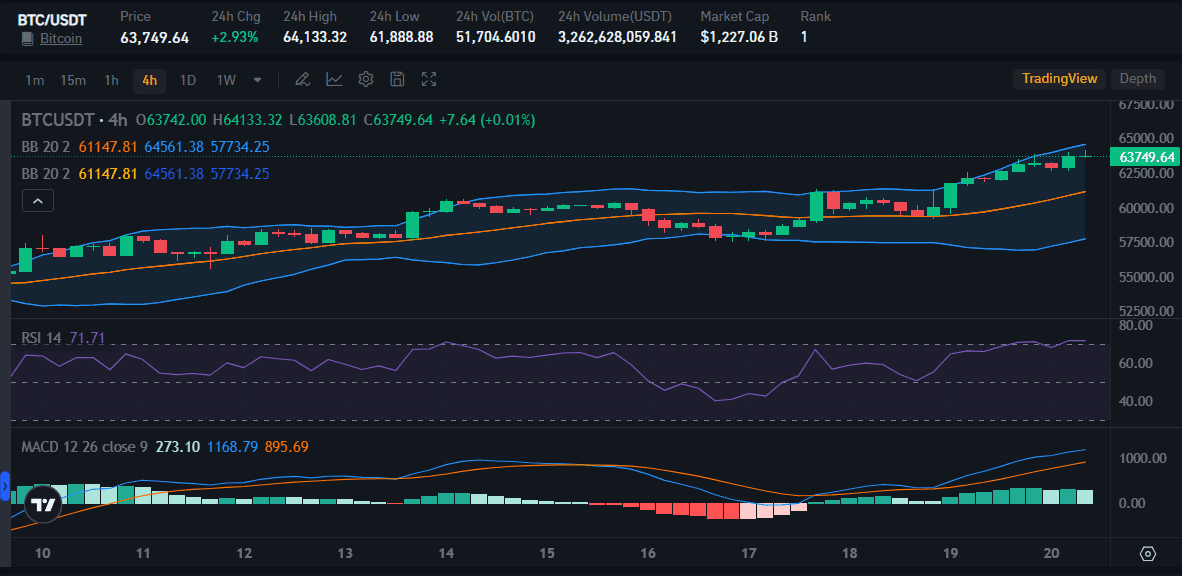
The Bitcoin price chart above is taken from Market Bitrue. It can be seen that the graph gives a very positive signal for the current condition of BTC. In fact, the RSI number is far above 50. With the number 71.71, buying BTC tokens is becoming a popular trend compared to selling it.
The MACD indicator is also rising above the border line. The gap between the two lines indicating that BTC will soon experience an impressive bull run.
Current technical analysis is quite impressive. However, seeing that the flow of crypto coin prices is always fluctuating, you can always do research before making an investment. You must always do the DYOR technique.
To make it easier for you to do independent research, the Bitrue website can help you. Because, Bitrue provides easy access for you to check the price conditions of BTC and other crypto coins in real time.
Whales Selling BTC in Large Amounts
When the price of Bitcoin finally reached more than $63,000, a whale actually sold the BTC tokens he owned. No half-hearted, whate sold up to 1,030 BTC with a selling value of approximately $64.3 million on one of the global crypto exchanges.
This action certainly attracts attention. Moreover, BTC token holders are having fun celebrating the increase in BTC prices. However, selling tokens when their value rises is actually common in the crypto industry. This is a strategy to make a profit, especially when the token holder buys it when the price drops.
However, the slightest movement from investors in the crypto industry certainly has an impact on the state of the token. So, what is the impact of selling this large amount of BTC? Pay attention to the following points.
- BTC prices can change along with selling large amounts of Bitcoin and affect the existing RSI indicator2. This BTC sale can trigger BTC price volatility
BTC and Its Popularity
After the Fed announced it would cut interest rates by 50 bps, Bitcoin prices tended to rise. This could trigger an increase in the prices of other tokens as well so that the crypto industry experiences a positive price shift.
Bitcoin is called the king of crypto for a reason. The reason is, when the price of BTC experiences an increase or decrease, the prices of other tokens will also be affected, both in positive and negative directions.
Even though when the price drops or during the Bitcoin halving the price of alternative coins will tend to rise because BTC dominance falls, Bitcoin’s popularity remains brilliant. This oldest token will still be suitable for investment purposes.
When you are interested in investing in BTC, you can learn how to buy Bitcoin. Check prices Bitcoin to USD It can also be used as primary research to check current prices so that you can determine the appropriate allocation of investment funds according to your abilities.


You must be logged in to post a comment.